The Cynergy Bank 'Business Births & Deaths Index'
Cynergy Bank’s latest Business Births and Deaths Index draws on ONS and Companies House data for October to December and provides an overview of the UK economy in 2025.
The number of businesses shutting down or leaving* the UK are bigger, employ more people and generate more turnover than ever before**, leaving start-ups unable to replace the jobs and economic value being lost.
Cynergy Bank Index - business closures
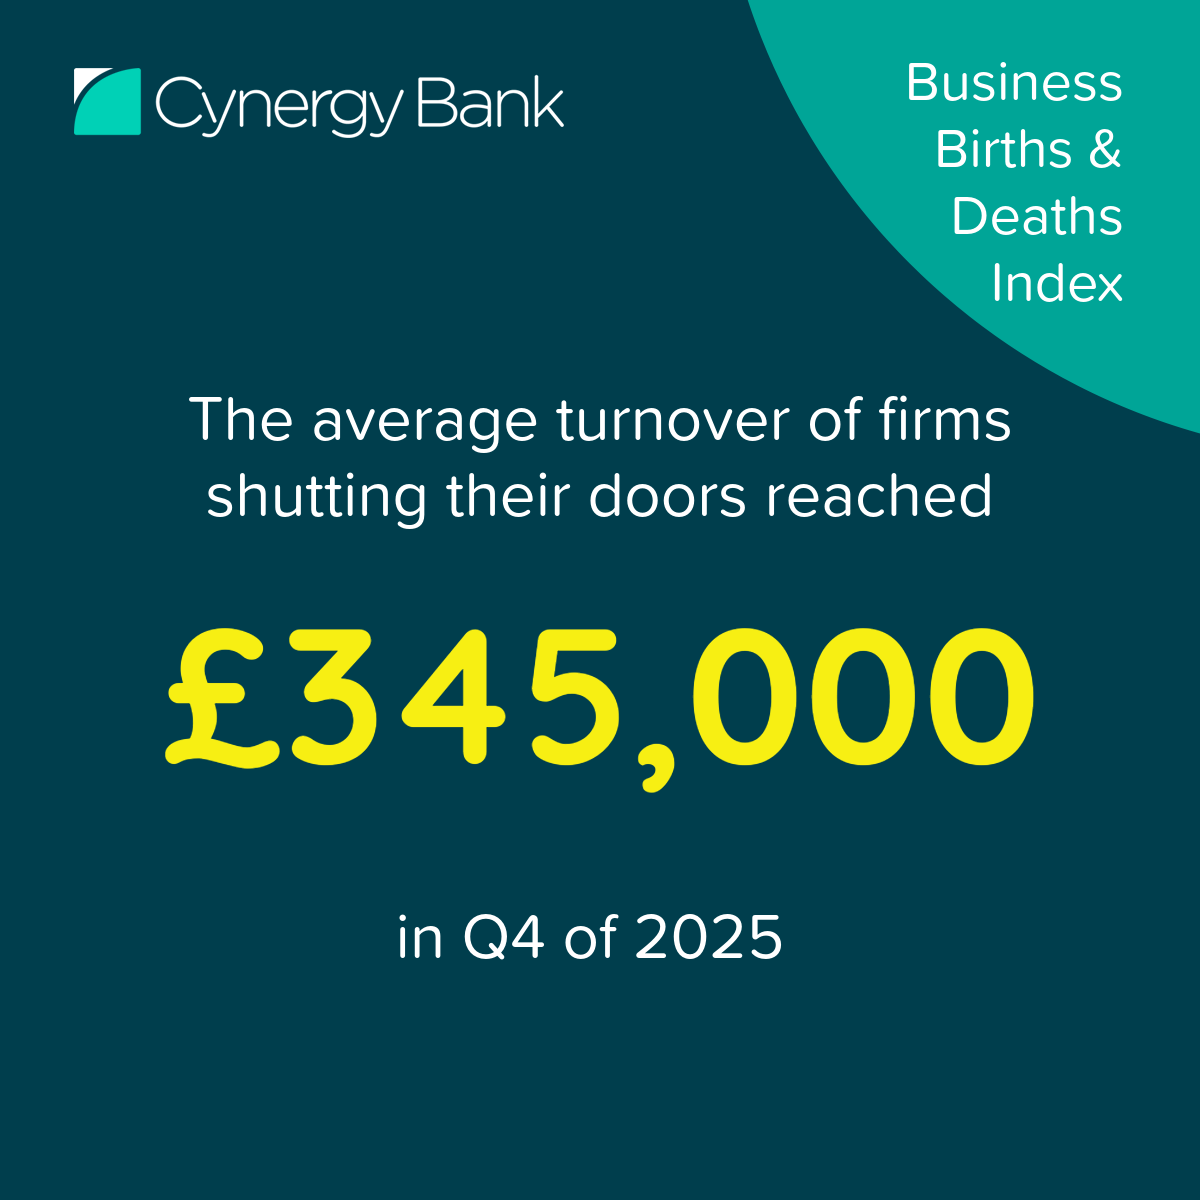
The Index shows that while 285,245 businesses closed throughout 2025 (3.5% fewer than in 2024), the firms failing were larger than at any point since records began.
In 2025, the average turnover of companies that closed reached a record £315,000, rising sharply to £345,000 in the final quarter of the year. As recently as 2021, the equivalent figure stood at £205,000, underlining how far the scale of business failures has grown.
These firms also employ more people. Businesses that closed in 2025 had an average of 2.95 employees, the second-highest annual figure on record, exceeded only marginally in 2019 at 2.98, highlighting that on overage closures are increasingly affecting more substantial employers.
Cynergy Bank Index - business closures
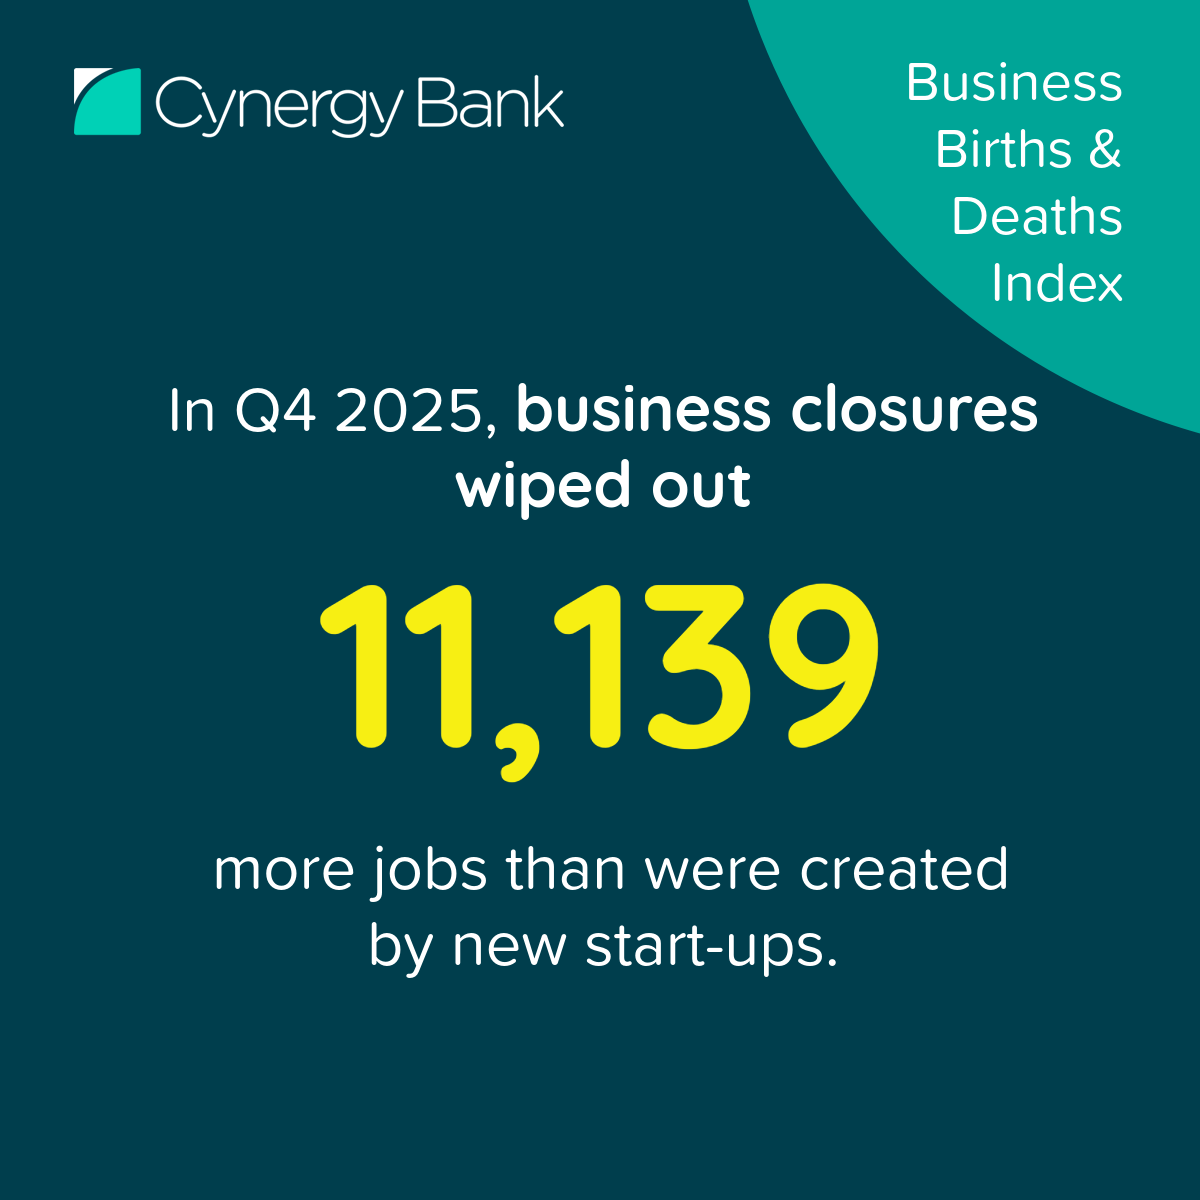
The impact intensified towards year-end. In Q4 2025, business closures wiped out 11,139 more jobs than were created by new start-ups, making it one of the most damaging quarters for net employment in recent years.
While new businesses continue to form, they are hiring fewer people.
Across 2025, start-ups created just 846,665 jobs, the lowest annual total since the start of the ONS data set in 2017. The average start-up employed only 2.7 people, again the lowest annual average and down from 3.5 in 2017, limiting their ability to offset rising job losses elsewhere in the economy.
Cynergy Bank Index - new business
In Q4 2025, the total turnover generated by new firms (£20.74 bn) was almost £2bn lower than the turnover of businesses that shut down (£22.66bn), marking a clear deterioration in the UK’s business dynamism.
Cynergy Bank Index - Sector winners and losers
Despite the challenging backdrop, Cynergy Bank’s Business Health Score***, which measures the ratio of new businesses created to those lost reveals sharp divergences between sectors.
Health and Social Care was among the strongest performers of 2025, posting an annual score of 1.29. The private health and social care sector has expanded every year since 2019, consistently recording scores above 1 and delivering a net gain of 18,380 businesses over the past six years.
Real Estate emerged as the strongest-performing sector overall, recording the highest annual Business Health Score of 1.46 and a net increase of 4,400 businesses in 2025, reflecting resilient demand and continued policy focus on housing supply.
Agriculture recorded the weakest performance of any sector, with a score of just 0.52, meaning only half of the farms closing are being replaced by new agricultural businesses. The sector saw 6,390 farms close during 2025 - the highest annual number since the dataset began in 2017 - underlining the mounting pressures facing UK agriculture.
Regional disparities
The North East has outperformed the rest of the country with a score of 1.20, narrowly beating London at 1.19, and compared to the national average of 1.07. In contrast, the South West and West Midlands are experiencing the most significant business closures, with scores of 0.95.***

"This data shows a clear shift in the UK economy. The businesses closing are larger and take more jobs and economic value with them, while new firms are starting smaller and creating fewer roles.
“That imbalance matters for productivity and long-term growth. While sectors such as health, social care and real estate continue to expand, the wider challenge for policymakers is creating conditions that allow more businesses not just to start, but to scale.
“At Cynergy Bank, we remain focused on backing ambitious firms with the finance and expertise they need to grow, invest and create jobs.”
Nick Fahy
Chief Executive, Cynergy Bank
Annual regional data table
The below data table shows the annual Cynergy Bank Regional Health Scores for 2024-2021.
Region | 2025 | 2024 | 2023 | 2022 | 2021 |
|---|---|---|---|---|---|
UK | 1.10 | 1.03 | 0.92 | 0.87 | 1.03 |
England | 1.11 | 1.04 | 0.92 | 0.89 | 1.04 |
North East | 1.16 | 1.06 | 0.92 | 0.90 | 1.09 |
North West | 1.15 | 1.05 | 0.88 | 0.90 | 1.04 |
Yorkshire and Humber | 1.09 | 1.03 | 0.89 | 1.02 | 1.07 |
East Midlands | 1.04 | 0.94 | 0.85 | 0.89 | 1.01 |
West Midlands | 1.04 | 1.00 | 0.83 | 0.85 | 1.12 |
East | 1.10 | 1.02 | 0.95 | 0.87 | 0.99 |
London | 1.19 | 1.12 | 1.00 | 0.90 | 1.10 |
South East | 1.08 | 1.02 | 0.93 | 0.80 | 0.93 |
South West | 1.02 | 0.97 | 0.89 | 0.89 | 1.03 |
Wales | 1.02 | 0.95 | 0.85 | 0.88 | 0.95 |
Scotland | 1.09 | 1.02 | 0.92 | 0.84 | 0.88 |
Northern Ireland | 0.95 | 0.96 | 0.87 | 0.78 | 1.10 |
Methodology
Cynergy Bank’s report uses ONS quarterly data across 16 business sectors, available here: Business demography, quarterly, UK - Office for National Statistics. Available ONS data goes as far back as 2017.
Q4 2025 data was published on 29 January 2026. Business “births” and “deaths” are terms used by ONS. Strictly, these are enterprises added to, and removed from, the Inter-Departmental Business Register (IDBR), respectively. The IDBR is a comprehensive list of UK businesses used by government for statistical purposes.
NOTES and definitions
* Cynergy Bank’s Business Health Score divides the number of business births by the number of business deaths in any given industry to give a snapshot of overall sector health. For example, a score of 1.30 means for every one business going bust 1.3 new businesses are being created. Scores below 1 indicate more businesses are closing than being formed and the industry is in decline.
**Available ONS data goes as far back as 2017: Business demography, quarterly, UK - Office for National Statistics
*** ONS dataset for estate agents in 2024 available here: Estate agents by size and region - Office for National Statistics
**** ONS dataset on number of estate agents in 2017 available here: Analysis of enterprises in the UK in UK SIC 2007 sub classes of Division 68 Real Estate 2015-2022 - Office for National Statistics
Lending is subject to approval, terms and conditions apply.
This content is provided for informational purposes only and does not constitute financial advice.
Ways you can contact us


Email us
using our online form.
